Tag: Power BI
-
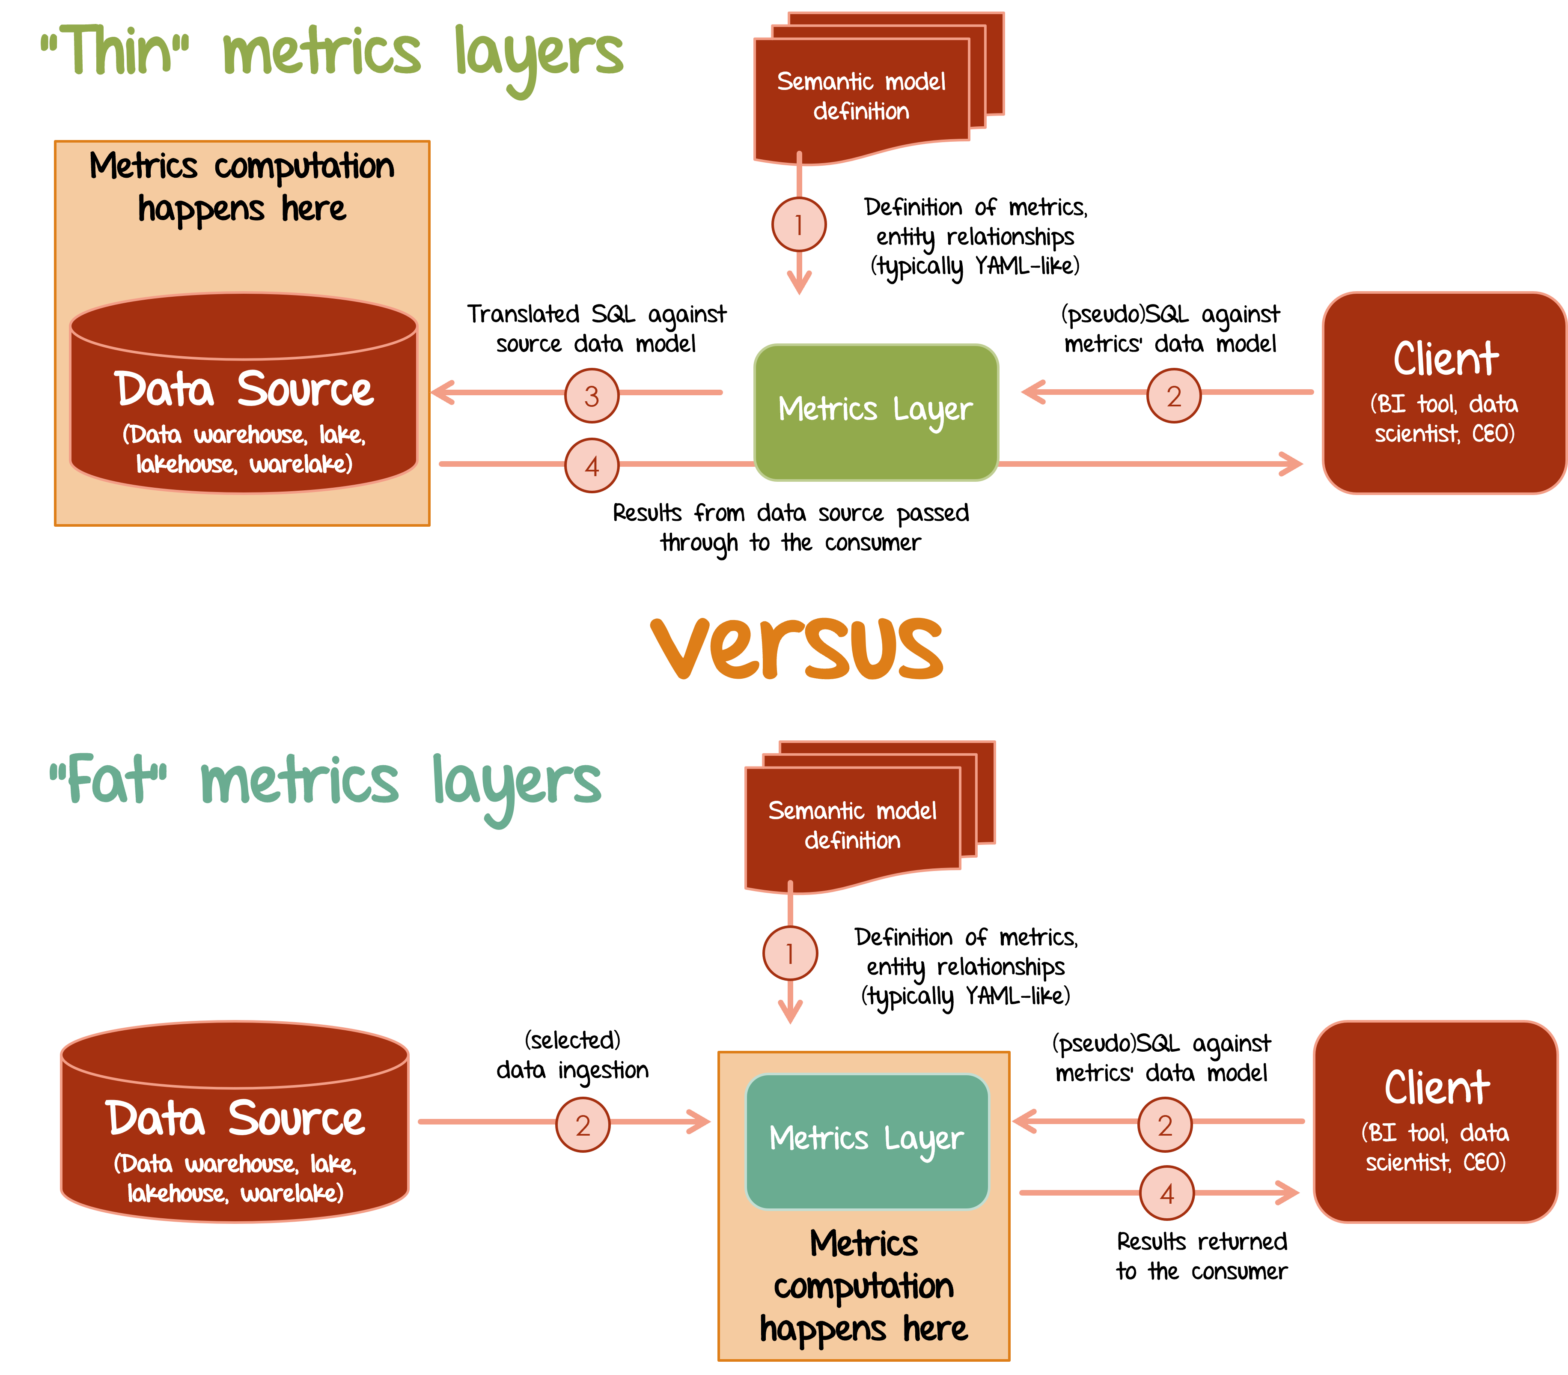
The Jungle of Metrics Layers and its Invisible Elephant
Metrics layer is the rising “missing component” of the modern data stack. I dive into functionalities provided by 10 prominent players in the space and contrast them with a player no one talks about: Microsoft Power BI.
-

“Football field” (variable-width bar) charts in R / Power BI
Displaying long-term contract value evolution via “football field” charts made with ggplot2 and integrated in Power BI.